Data analysis and visualization for business
This training will give you the tools to perform quantitative analysis and proper data visualization. Data analysis and visualization is an emerging field that focuses on the analysis, modeling and visualization of complex, high-dimensional data. This course will introduce advanced modeling, analysis and visualization techniques for business. It will focus on practical challenges involving complex real-world data and will include several case studies and practical work with the R programming language.
This training introduces, with concrete examples, the contributions of data analysis followed by visualization. It gives you a lot of autonomy in the analysis and visualization of data in a business context. The training aims to develop the following skills:
- To be able to design a document model that meets the expectations of the company, depending on the subject analyzed.
- Mastering a simple and efficient method of data retrieval
- To know graphic grammar and knowledge to select the right graphic to represent the right data.
- Know how to build a narrative framework that captivates your audience and reinforces the credibility of your analyses.
- Mastering the R-shiny tools to present results
The details
The main elements of this training include introduction to the rational of data analysis and visualization in business, data processing and ways of presenting results for decision making. The content of the training will include:
Analytical thinking about data in business
- Data opportunities
- Data Processing and Big Data
- Data capacity and data statistics as a strategic asset
- From business problems to data analysis and mining tasks, data mining
- Business understanding of data, data preparation, modeling, evaluation, and deployment
- Analytical techniques and technologies
- Answering business questions with these techniques
Telling a story with data:
- Importance of context
- Choosing an effective visual
- Focus public attention
- Thinking like a designer
- Dissection of model visuals
- Science to Business Narrative Lessons
- Case Studies
A few examples:
- Predictive modeling
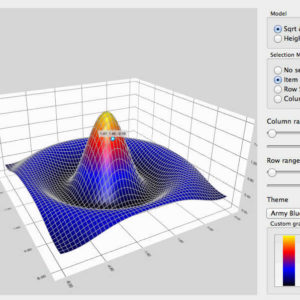
- Data visualization
- Analytical Decision Thinking
- Adapting a model to data and visualization performance
The clients
This training is intended for all analysts or other professionals seeking to acquire the necessary skills that will help conduct or understand the analysis of your company’s data.
- Level: Beginner
- Duration: Two days